Or, perhaps more appropriately, “A” Steinhaus conjecture, he/she (I’m guessing Hugo, so he. Perhaps I’ll look into it) seems to have made a couple. This conjecture (theorem) also goes by the name “The Three Gap Theorem”, or “The Three Distance Theorem”. Which is all a little annoying, I think. It makes looking for references 3 times as hard, I reckon. But it’s a pretty cool result, and I’m glad Dave Richeson brought it to my attention via his blog post on Three cool facts about rotations of the circle.
To write down the theorem, I’ll first introduce the notation for the “decimal part” of a real number, defined as
,
being the largest integer no bigger than
. Since I’ll be thinking about positive
, it is the value of
if you ignore digits to the left of the decimal point. This seems to be fairly common notation. Anyway…
The theorem goes something like this:
Theorem: Suppose that is irrational. Let
be a positive integer bigger than 1, and consider the
points
for
. These points partition the interval
into
subintervals. If the distances of these subintervals are calculated, there will be either 2 or 3 distinct distances.
The circle comes in by thinking of the interval as a circle with circumference 1. To help visualize it, Dr. Richeson made a pretty sweet GeoGebra applet.
I think this is a pretty initially surprising theorem. My initial shock has worn off just slightly, now that I’ve played with pictures and dug through a proof, but it’s still a wonderful result. I mean, irrational values are supposed to do weird things, right? Their multiples should bounce all over the place in the unit interval. And yet, they partition the circle into just 2 or 3 differently-sized gaps? Crazy talk. Also, the theorem as stated above isn’t as strong as it could be… you can say a bit more about the distances. I think I’ll talk more about it in another post.
I started reading about this theorem, after Dr. Richeson’s post, in the paper by Tony van Ravenstein. As I was reading the proof I got hung up on some details, and found that consulting the paper by Micaela Mayero got me over those difficulties. The paper by Mayero is essentially a formal proof written for the Coq formal proof system, so it sort of makes sense that details will be pretty fully explained in it. Either way though, it’s really not a long or particularly difficult proof (you mostly play with some inequalities).
I may return, in a future post, to talking about the proof, and I’ll certainly come back and tell you as I read more about further consequences and generalizations, and whatever else I find in some other papers I’m planning on looking at. But for now, let me mention a result in van Ravenstein’s paper. He proves that in going from the picture with points to the picture of
points, the
-th point will break up the oldest of the intervals with the largest length. The “age” of an interval is pretty intuitive. If a particular interval, say between multiples
and
comes in when there are
points, and those two points are still neighbors when there are
points, then the age of that interval, at stage
, is
(plus 1, if you want, it doesn’t matter).
To help picture what’s going on, I made an interactive Sage notebook. If you have an account on sagenb.org, or have Sage installed on your own computer and want to just copy my code over, you can look at my code and play with the notebook. I had hoped that publishing my notebook there would let you play with the interactive bits without you needing an account, but no dice. Sorry.
To give some sense of my notebook, and the theorem, I’ve got some pictures for you.
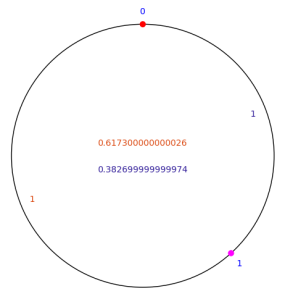
First, let’s take or so (basically 1 minus the golden ratio, nice and irrational). I’ve set up my notebook so that points travel from 0, at the top of the circle, clockwise, because that’s how it was done in the papers I was reading, and I thought it’d be less confusing. So here’s the starting picture, when there’s just the points 0 and
:
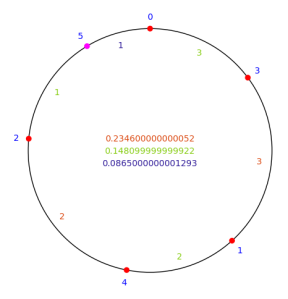
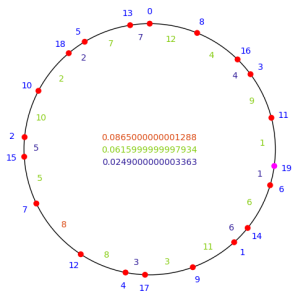
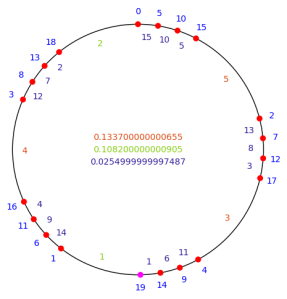
Along the outside of the circle, at each dot, I list which multiple it is. The “newest” dot is magenta, instead of red (probably not great color choices… mess with my code and make your own :)). In the center of the circle I list the lengths of the intervals, in decreasing order. Along each interval, I also write the age of that interval, and color-code the text to the list of distances. I’ve decided to always have the largest length be red-orangeish, the smallest length blue-ish, and the middle length (if there is one) green-ish.
In the picture above, the interval on the left is clearly the oldest of the longest length intervals, so the theorem is that when we add another point, this interval will get broken up by that point. Which is clearly true in this case.
Here’s another picture, using the same , but slightly more points, showing that three gaps occur:
And, finally, 20 points:
Here’s a picture using a starting a little bigger than 0.6, showing 20 points:
I like how the points seem to develop in clusters (also evidenced by Dr. Richeson’s app).
I guess that’s probably enough for now. Like I said, I’m hoping to have plenty more to say about things related to all of this soon…
Postscript: I want to make a few shout-outs. I thought putting them at the end of this post might interrupt any sort of flow of the article (if there is any) a little less.
- I was inspired to make an interactive sage notebook by Mike Croucher’s recent posts at Walking Randomly.
- I messed with choosing colors, a little bit, using colorschemedesigner.com, mentioned recently in an article at smashingapps.com
mixedmath pointed out in the comments that public sagenb notebooks are currently (20130623) down. The code looks terrible in the comments, so I figured I’d just add it here:
defalpha = 0.38197 # golden ratio, ish
maxN = 20 # maximum number of points to put in the circle
tolerance = 10^(-7) # to decide when two floats are equal

# some colors, lower index corresponds to bigger distance
segcolor = [(0.86,0.28,0.06),(0.52,0.80,0.06),(0.19,0.11,0.60)]

# the unit circle
basepic = circle((0,0),1,rgbcolor=(0,0,0))

# floating part of a number
flpart = lambda v: v-int(v)

# a point v units along the circumpherence (of length 1 unit) at radius R
coords = lambda v,R: (R*sin(2*pi*v), R*cos(2*pi*v))

# draw dots on the circle, distinguish the "newest" by color
olddot = lambda v:circle(coords(v,1),0.02,rgbcolor=(1,0,0),fill=True)
newdot = lambda v:circle(coords(v,1),0.02,rgbcolor=(1,0,1),fill=True)

# storage
picturestore = {}

def addtopicturestore(alphaval):
    """ Make the picture for alphaval and all (up to maxN) numbers of points """
    picture = [basepic for m in range(0,maxN+1)] # to go into storage
    multiple = [flpart(m*alphaval) for m in range(0,maxN+1)] # the points

    # we care most about which distances are longest/shortest, and how
    # long each interval has been a certain distances
    # we'll build up these next few arrays as we increment the number of points
    # disttosucc[m] = actual distance to next point
    # agethisdist[m] = how long the interval after the point has been this distance
    # distsize[m] = 0,1,2 if the interval after point m is a big,med,or small interval
    disttosucc = [1] + [-1 for m in range(0,maxN)]
    agethisdist = [1] + [-1 for m in range(0,maxN)]
    distsize = [0] + [-1 for m in range(0,maxN)]

    # now, build up to having all of the points
    # currently, we suppose we only know the 0 point
    for N in xrange(2,maxN+1):

        newpt = multiple[N-1]

        # the new point breaks the oldest interval among those with biggest length
        # so find that interval
        oldestbigdist = distsize.index(0)
        for idx in xrange(oldestbigdist + 1, N-1):
            if distsize[idx] == 0 and agethisdist[idx] > agethisdist[oldestbigdist]:
                oldestbigdist = idx
        # newpt is the successor of oldestbigdist

        # update the only distances that change when adding this point
        splitdist = disttosucc[oldestbigdist]
        disttosucc[oldestbigdist] = newpt - multiple[oldestbigdist]
        disttosucc[N-1] = splitdist - disttosucc[oldestbigdist]

        # reset the age counts for these two new distances
        agethisdist[oldestbigdist] = 1
        agethisdist[N-1] = 1

        # now we recompute which distances are biggest/smallest

        # first, what are the 2 or 3 distances?
        distances = [disttosucc[oldestbigdist], 0, disttosucc[N-1]]
        if disttosucc[oldestbigdist] < disttosucc[N-1]:
            distances[0] = disttosucc[N-1]
            distances[2] = disttosucc[oldestbigdist]
        for idx in xrange(0,N):
            # we're using the fact that there are only 3 distances,
            # and that we already know two of them
            if disttosucc[idx] - distances[0] > tolerance:
                distances[1] = distances[0]
                distances[0] = disttosucc[idx]
            elif distances[0] - disttosucc[idx] > tolerance:
                if distances[2] - disttosucc[idx] > tolerance:
                    distances[1] = distances[2]
                    distances[2] = disttosucc[idx]
                elif disttosucc[idx] - distances[2] > tolerance:
                    distances[1] = disttosucc[idx]
            # while we're at it, update age of un-changed intervals
            if not idx == oldestbigdist and not idx == N-1:
                agethisdist[idx] += 1

        # now that we know the 2-3 distances, we can tell which points have which dist.
        for idx in xrange(0,N):
            smidx = 0
            while abs(distances[smidx]-disttosucc[idx]) > tolerance:
                smidx += 1
            distsize[idx] = smidx

        # finally, build the picture
        dots = [olddot(multiple[m]) for m in xrange(0,N-1)] + [newdot(multiple[N-1])]
        labels = [text(str(m),coords(multiple[m],1.1),rgbcolor=(0,0,1))
                  for m in xrange(0,N)]
        agelabels = [text(str(agethisdist[m]),
                           coords(multiple[m]+.5*disttosucc[m],.9),
                           rgbcolor=segcolor[distsize[m]])
                      for m in xrange(0,N)]
        distancelegend = text(str(distances[0]),(0,.1),rgbcolor=segcolor[0])
        distancelegend += text(str(distances[2]),(0,-.1),rgbcolor=segcolor[2])
        if distances[1]:
            distancelegend += text(str(distances[1]), (0,0), rgbcolor=segcolor[1])
        picture[N] += sum(dots)+sum(labels)+sum(agelabels)+distancelegend

    # outside the loop, all pictures have been computed, just store them
    picturestore[alphaval] = picture


# set up the interactive bits
@interact
def _( alpha=slider(0.0001,0.9999,0.0001,default=defalpha,label='Distance'),
       N=slider(2,maxN,1,default=2,label='Number of Points') ):
    if alpha not in picturestore:
        addtopicturestore(alpha)
    show(picturestore[alpha][N], axes=False, aspect_ratio = 1)


December 23, 2009 at 11:47 pm |
Very nice! I’m looking forward to anything else you write on this topic.
There is another, similar theorem also called the Three Step/Gap theorem that says the following. Let I=[0,b) be an interval on the circle of circumference 1. Look at the itinerary of an orbit: 0,0,0,1,1,0,… where a term in the itinerary is 0 or 1 depending on whether the point is in or not in I. It turns out that the blocks of 0’s or 1’s come in three different lengths and two lengths add to give the third. (I say a little bit about this and give some references in section 1 of this paper: http://arxiv.org/abs/0801.1639, which will be appearing in print soon.)
This theorem has a very similar feel to the result you describe. One of the papers (Slater’s, maybe?) says that they are “dual” results. I did quick read a few years ago and couldn’t follow the paper. I meant to go back and look at it again when I had more time, but never did. I wanted (and still want) to know if they were LITERALLY dual results—that is, there is some way to go back and forth between them, pairing up interval lengths with lengths of 0/1 blocks—or if he meant dual in some looser, less rigorous sense.
I have always been intrigued by continued fractions, but my training in that type of number theory is minimal. I always have trouble following those arguments
You may want to check this out.
Dave
Ps. No need to address me as “Dr. Richeson” 🙂
December 23, 2009 at 11:57 pm |
Your paper on the arxiv is one of the ones on my list 🙂 And the connection to continued fractions is pretty high on my list of things to look at, as you might guess, so perhaps I’ll be able to sort something out. Time will tell…
December 24, 2009 at 4:20 am |
Hey Nick
Very cool stuff. I’ll be reading this in more detail over Christmas but for now I thought you might be interested to know that there is an alternative visualisation of the three-distance theorem done in Mathematica here
http://demonstrations.wolfram.com/ThreeDistanceTheorem/
To be honest I prefer the look of yours.
Cheers,
Mike
December 24, 2009 at 8:06 am |
Thanks! And for the link as well, I’d not run across that. Of course, I prefer mine too (though that one looks more colorful) 🙂 I know there are free bits of Mathematica, but there’s more free bits of Sage, so it wins for me.
December 27, 2009 at 5:46 am |
[…] called interact and I have been playing with it a bit recently (see here and here) along with some other math bloggers. The Sage team have done a fantastic job with the interact function but it is missing a major […]
June 20, 2013 at 11:51 am |
I know I’m late to the party, but I was wondering if you still had your sage code that you used? I tried following it up on sagenb, but I had no luck. All I got was a 404 page saying that public worksheets are currently disabled (but it seems this is the case for all public worksheets, not just yours).
June 20, 2013 at 11:52 am |
I’m responding to myself because I’m silly and want to be notified of follow-up comments via email.
June 23, 2013 at 6:54 pm |
Hi mixedmath. Sorry about the delay getting back to you. I think the code is as follows. I hope wordpress doesn’t mess with the spacing too much, being python and all…
defalpha = 0.38197 # golden ratio, ish
maxN = 20 # maximum number of points to put in the circle
tolerance = 10^(-7) # to decide when two floats are equal
# some colors, lower index corresponds to bigger distance
segcolor = [(0.86,0.28,0.06),(0.52,0.80,0.06),(0.19,0.11,0.60)]
# the unit circle
basepic = circle((0,0),1,rgbcolor=(0,0,0))
# floating part of a number
flpart = lambda v: v-int(v)
# a point v units along the circumpherence (of length 1 unit) at radius R
coords = lambda v,R: (R*sin(2*pi*v), R*cos(2*pi*v))
# draw dots on the circle, distinguish the “newest” by color
olddot = lambda v:circle(coords(v,1),0.02,rgbcolor=(1,0,0),fill=True)
newdot = lambda v:circle(coords(v,1),0.02,rgbcolor=(1,0,1),fill=True)
# storage
picturestore = {}
def addtopicturestore(alphaval):
“”” Make the picture for alphaval and all (up to maxN) numbers of points “””
picture = [basepic for m in range(0,maxN+1)] # to go into storage
multiple = [flpart(m*alphaval) for m in range(0,maxN+1)] # the points
# we care most about which distances are longest/shortest, and how
# long each interval has been a certain distances
# we’ll build up these next few arrays as we increment the number of points
# disttosucc[m] = actual distance to next point
# agethisdist[m] = how long the interval after the point has been this distance
# distsize[m] = 0,1,2 if the interval after point m is a big,med,or small interval
disttosucc = [1] + [-1 for m in range(0,maxN)]
agethisdist = [1] + [-1 for m in range(0,maxN)]
distsize = [0] + [-1 for m in range(0,maxN)]
# now, build up to having all of the points
# currently, we suppose we only know the 0 point
for N in xrange(2,maxN+1):
newpt = multiple[N-1]
# the new point breaks the oldest interval among those with biggest length
# so find that interval
oldestbigdist = distsize.index(0)
for idx in xrange(oldestbigdist + 1, N-1):
if distsize[idx] == 0 and agethisdist[idx] > agethisdist[oldestbigdist]:
oldestbigdist = idx
# newpt is the successor of oldestbigdist
# update the only distances that change when adding this point
splitdist = disttosucc[oldestbigdist]
disttosucc[oldestbigdist] = newpt – multiple[oldestbigdist]
disttosucc[N-1] = splitdist – disttosucc[oldestbigdist]
# reset the age counts for these two new distances
agethisdist[oldestbigdist] = 1
agethisdist[N-1] = 1
# now we recompute which distances are biggest/smallest
# first, what are the 2 or 3 distances?
distances = [disttosucc[oldestbigdist], 0, disttosucc[N-1]]
if disttosucc[oldestbigdist] tolerance:
distances[1] = distances[0]
distances[0] = disttosucc[idx]
elif distances[0] – disttosucc[idx] > tolerance:
if distances[2] – disttosucc[idx] > tolerance:
distances[1] = distances[2]
distances[2] = disttosucc[idx]
elif disttosucc[idx] – distances[2] > tolerance:
distances[1] = disttosucc[idx]
# while we’re at it, update age of un-changed intervals
if not idx == oldestbigdist and not idx == N-1:
agethisdist[idx] += 1
# now that we know the 2-3 distances, we can tell which points have which dist.
for idx in xrange(0,N):
smidx = 0
while abs(distances[smidx]-disttosucc[idx]) > tolerance:
smidx += 1
distsize[idx] = smidx
# finally, build the picture
dots = [olddot(multiple[m]) for m in xrange(0,N-1)] + [newdot(multiple[N-1])]
labels = [text(str(m),coords(multiple[m],1.1),rgbcolor=(0,0,1))
for m in xrange(0,N)]
agelabels = [text(str(agethisdist[m]),
coords(multiple[m]+.5*disttosucc[m],.9),
rgbcolor=segcolor[distsize[m]])
for m in xrange(0,N)]
distancelegend = text(str(distances[0]),(0,.1),rgbcolor=segcolor[0])
distancelegend += text(str(distances[2]),(0,-.1),rgbcolor=segcolor[2])
if distances[1]:
distancelegend += text(str(distances[1]), (0,0), rgbcolor=segcolor[1])
picture[N] += sum(dots)+sum(labels)+sum(agelabels)+distancelegend
# outside the loop, all pictures have been computed, just store them
picturestore[alphaval] = picture
# set up the interactive bits
@interact
def _( alpha=slider(0.0001,0.9999,0.0001,default=defalpha,label=’Distance’),
N=slider(2,maxN,1,default=2,label=’Number of Points’) ):
if alpha not in picturestore:
addtopicturestore(alpha)
show(picturestore[alpha][N], axes=False, aspect_ratio = 1)
June 23, 2013 at 6:59 pm |
Guh, ugly code in the comments. Updated the post.
June 23, 2013 at 8:43 pm |
Thanks for that – I was happily surprised to see you respond (I noticed the front post is quite old now and got worried).